Is the site slow when you save in the builder, or on one particular page? The Request Profiler records real requests from your own browser and shows where the time goes. Site Weight measures the parts of the site that make WordPress and Divi heavy.
The Request Profiler
While it records, the profiler times every request your browser makes: page views, admin screens, builder saves, Quick Edit, AJAX and REST calls. For each request it records:
- A timeline of WordPress’s loading steps, and how long each plugin and the theme take to load.
- Time spent in each plugin, the theme and each part of Divi, and the slowest hook callbacks.
- Database queries: how many, how long, the slowest, and those that repeat.
- Calls to other servers, and which code started each one.
- PHP errors in that request.
- Every time Divi clears its CSS cache: how much it cleared, and which code triggered it.
Visitors and other logged-in users are never recorded, and their pages aren’t affected. Your recorded requests skip page caching, so you see the real work the server does.
Record a slow action
- Go to Divi Doctor → Performance. The Request Profiler tab opens.
- Under Record for, choose 5, 15, 30 or 60 minutes (15 is the default), then click Start recording.
- In the same browser, do the slow thing: open the page, or open it in the Visual Builder and save, or use Quick Edit.
- Come back to Divi Doctor → Performance and reload. Your requests are listed under Recorded requests.
- Click Stop recording when you’re done, or let the time run out. Recording stops by itself.
You can also start from the admin bar on any screen, including the front end: Divi Doctor → Record slow requests (15 min). While recording, the admin bar item turns red and reads Divi Doctor: recording with the minutes left; its menu has View recorded requests and Stop recording.
Only one browser can record at a time. If another browser is recording, the screen shows Busy, and starting in your browser takes over the session. On multisite, only a network (super) admin can start or stop recording.
The recorded requests list
Newest requests come first. Each row shows when it ran, its type (Page, Admin, AJAX, REST or Cron), the request, the HTTP status, the total time with a bar, peak memory, database queries and their time, outgoing calls, PHP errors and Divi cache clears. A time of 3 seconds or more is shown in yellow, and 8 seconds or more in red. A Divi clear count such as 2 (1 full) means one of the clears emptied the whole cache.
Use the filters above the list to show one request type, hide WordPress’s background heartbeat calls (hidden by default), or show only requests slower than a number of milliseconds. Divi Doctor keeps the latest 300 requests and lists the newest 100. Delete recorded requests removes them all.
Read one request
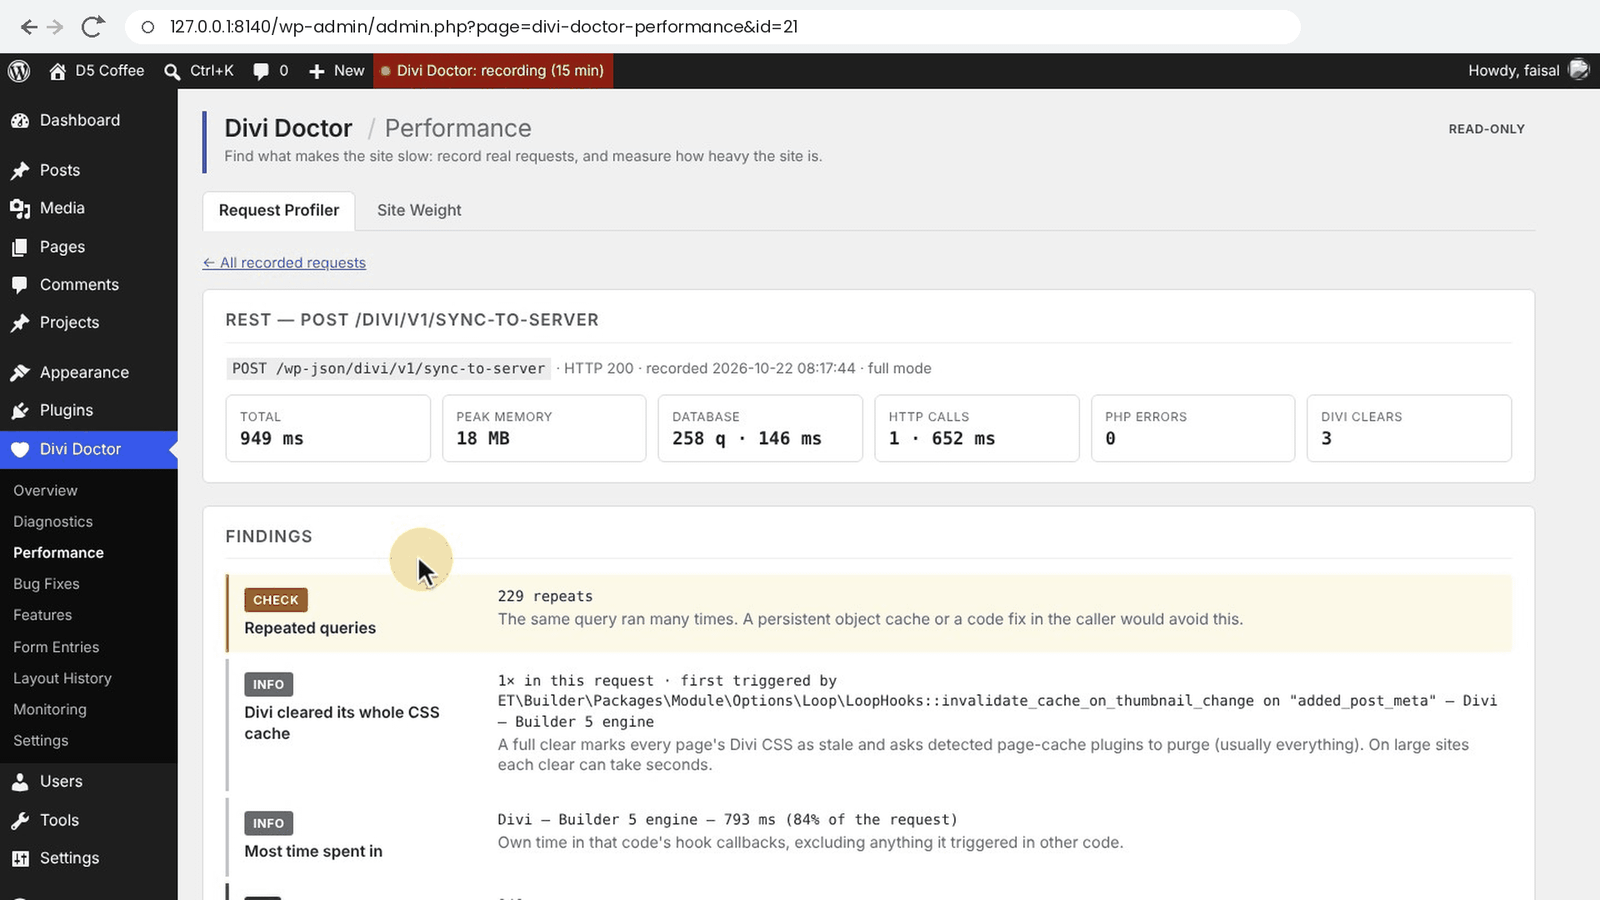
Click a request to open its breakdown. The top shows Total, Peak memory, Database, HTTP calls, PHP errors and Divi clears. Then come these sections, as far as the request has data for them:
| Section | What it shows |
|---|---|
| Findings | Plain-language results, most important first. For example Request time (3 seconds or more is a Check, 8 or more an Issue), Divi cleared its whole CSS cache, Most time spent in, Slowest callback, Slow outgoing request, Database time, Repeated queries, Memory and PHP errors. |
| Timeline | WordPress’s loading steps and the time between them. A long gap before a step means the work just before it was slow. |
| Time by plugin, theme and Divi | Own time per plugin, theme and part of Divi, such as Divi — Builder 5 engine. |
| Slowest hook callbacks | The functions that took longest, with the hook, the plugin or theme they belong to, and how often they ran. Total includes everything a callback triggered; Own leaves out time spent in other timed callbacks. |
| Divi CSS cache clears | Each clear: what it covered (one post, Divi’s global CSS, or All posts, all CSS (full clear)), whether page caches were left alone, and the code that triggered it. |
| Outgoing HTTP calls | Each call to another server, its time and result, and the code that started it. |
| Database | Query count and time, the slowest queries with the code that ran them, and repeated queries. |
| PHP errors in this request | Each error with its level, count, file and line. |
| Load times | How long the theme setup and each plugin’s main file took to load. |
| Report | A plain-text report you can copy with Copy report, and Download JSON for the full data. |
What to do with the results
- One plugin takes most of the time: test the slow action with that plugin deactivated on a staging copy, or ask its developer with the report attached.
- Divi cleared its whole CSS cache: the finding names the code that triggered it. A full clear marks every page’s CSS as out of date and asks detected page-cache plugins to purge, usually everything. If it happens on every save, look at the triggering plugin or setting.
- Slow outgoing request: the page waited for another server, such as a license check or an API. The row names the code that made the call.
- Database time or Repeated queries: see the slowest and repeated queries in the Database section. A persistent object cache can help with repeats.
Note: The report keeps only the host and path of addresses, and removes quoted values from database queries. Still, review it before you share it outside your team.
How recording works
To time plugins that load before Divi Doctor, the profiler writes a small loader file, 0-divi-doctor-profiler.php, to wp-content/mu-plugins while you record. It’s removed when you stop recording, when the time runs out (on your next admin page view), or when you deactivate Divi Doctor. The loader only does anything for the browser that’s recording.
If Divi Doctor can’t write that file, the screen says Limited mode. Recording still works, but the load times of plugins that load before Divi Doctor, and the very first database queries, are missing.
Site Weight
Divi Doctor → Performance → Site Weight measures how heavy the site is in the places that slow down WordPress, WooCommerce and Divi. It’s read-only; every row shows the measured value.
| Section | What it measures |
|---|---|
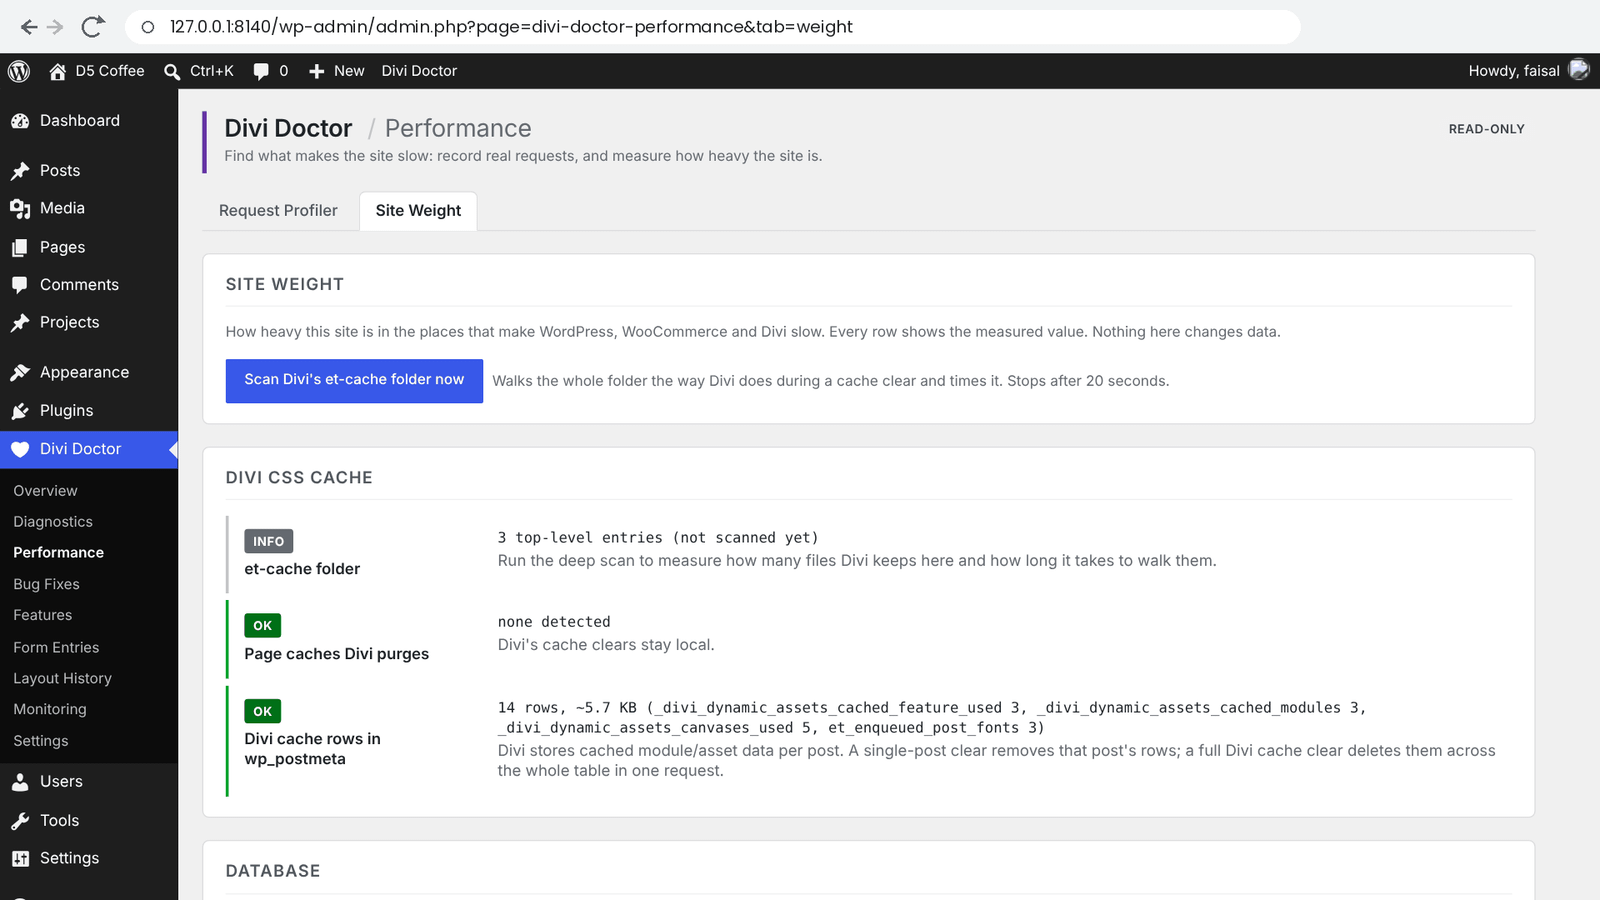
| Divi CSS cache | The size of Divi’s et-cache folder and how long it takes to walk through it, Stale markers (CSS files Divi has marked as out of date), Page caches Divi purges when it clears its CSS, and Divi cache rows in wp_postmeta. |
| Database | Database size and the largest tables, Autoloaded options, Transients (stored and expired) and Revisions. |
| Background work | WP-Cron events and how many are overdue, and the Action Scheduler queue used by WooCommerce and many other plugins. |
| Caching & PHP runtime | PHP version (security support), OPcache, Xdebug and Persistent object cache. |
| Content scale | Posts by type, Terms by taxonomy, Users and Active plugins. |
| WooCommerce | Shown only when WooCommerce is active, including its Customer sessions table and Product lookup table. |
Some of the thresholds behind the verdicts:
- et-cache size: walking the folder takes 800 ms or more, or it has 5,000 or more folders, is a Check; 3 seconds or 20,000 folders is an Issue. Divi walks this whole folder every time it clears its CSS cache, and on Divi 5 that happens when posts and products are saved.
- Autoloaded options: 800 KB or more is a Check, 2 MB or more an Issue. WordPress loads these on every request. The row lists the five largest, so you can see which plugin they belong to.
- WP-Cron: 20 or more events overdue by 15 minutes or more is a Check. See Cron Setup.
- Action Scheduler queue: 100 or more late actions is a Check, 1,000 or more an Issue.
- PHP version (security support): versions older than 8.2 are a Check. They still run Divi 5, but no longer get security fixes from the PHP project.
- OPcache: missing or switched off is an Issue; PHP then recompiles every file on every request. Ask your host to switch it on.
Scan Divi’s cache folder
Until you run a scan, the et-cache folder row only counts the folder’s top-level entries. Click Scan Divi’s et-cache folder now to walk the whole folder the way Divi does during a cache clear and time it. The scan stops after 20 seconds; on a very large folder the counts then start with at least. The result stays on the page, with how long ago it ran, until you scan again.
If the folder is large, clearing Divi’s static CSS removes those files; Divi rebuilds them as pages are visited. Then use the Request Profiler to see how much time cache clears add to a save.
The key Site Weight results, such as autoloaded options, overdue cron events, the Action Scheduler queue, PHP version and OPcache, also feed the ranked list on the Overview.
Questions
How do I find out why Divi is slow when I save a page?
Go to Divi Doctor → Performance and click Start recording. In the same browser, open the page in the Visual Builder and save it, then come back and reload. The request is listed with its total time, and its breakdown shows the time spent in each plugin, the theme and each part of Divi, the slowest hook callbacks, the database queries and the calls to other servers.
Does the Request Profiler slow down my site for visitors?
No. Visitors and other logged-in users are never recorded, and their pages aren’t affected. The profiler only times the requests of your own browser while you record.
How do I see which plugin makes a WordPress page slow?
Record the slow page with the Request Profiler and open the request. Time by plugin, theme and Divi shows the time of each plugin, the theme and each part of Divi, and Slowest hook callbacks lists the functions that took longest, with the plugin or theme they belong to.
What does “Divi cleared its whole CSS cache” mean?
A full clear marks every page’s CSS as out of date and asks detected page-cache plugins to purge, usually everything. The finding names the code that triggered it. If it happens on every save, look at the triggering plugin or setting.
How long does the Request Profiler record?
You choose 5, 15, 30 or 60 minutes; 15 is the default. Recording stops by itself when the time runs out, or when you click Stop recording.
Can I send a recorded request to a developer or to support?
Yes. The Report section of a request has a plain-text report you can copy with Copy report, and Download JSON for the full data.
How many requests does the profiler keep?
Divi Doctor keeps the latest 300 requests and lists the newest 100. Delete recorded requests removes them all.
Can two people record at the same time?
No. Only one browser can record at a time. If another browser is recording, the screen shows Busy, and starting in your browser takes over the session. On multisite, only a network admin can start or stop recording.
Is the Request Profiler in the free plugin?
No. The Request Profiler and Site Weight are part of Divi Doctor Pro. See Doctor for Divi (free) and Divi Doctor Pro.